How Excessive Debt Destroyed a Directionally Correct Business Strategy
Background & The Big Bet
Between 2005 and 2013, India was on a structural growth trajectory, highways, housing, automobiles, railways, and power projects were all expanding rapidly. The Bhushan Group, comprising Bhushan Steel and Bhushan Power & Steel (BPSL), made an aggressive bet on this trend, building out plants (Capacity expansion), blast furnaces, rolling mills, and downstream facilities at scale.
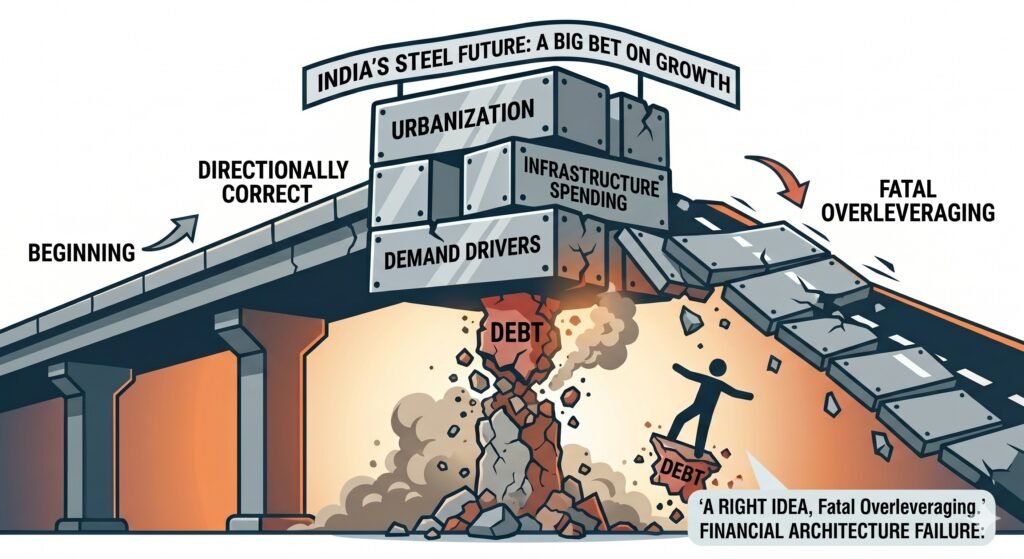
Importantly, the directional thesis was correct. India’s per capita steel consumption remained far below developed economies, and long term demand drivers like urbanization, infrastructure spending, defense manufacturing were real and durable.
| “The companies correctly identified India’s steel future. The tragedy was not a wrong industry bet, it was fatal overleveraging on a right idea.” |
What Went Wrong: Three Compounding Failures
| Global Headwinds 1. China flooded markets with cheap steel 2. Global oversupply crashed prices 3. Infrastructure spending slowed post 2012 | Debt Trap 1. Expansion funded almost entirely by bank debt 2. Interest burden outpaced operating cash flows₹57,000 Cr (Steel) + ₹47,000 Cr (BPSL) at peak | Governance Failures 1. Alleged fund diversion via shell companies 2. Accounting irregularities surfaced Banks lost confidence; refinancing dried up |
Debt Escalation Timeline
| Bhushan Steel | Bhushan Power & Steel | Debt/EBITDA (BS / BPSL) | |||
| Year | Debt | EBITDA | Debt | EBITDA | |
| FY 2011 | ~₹30,000 Cr | ~₹3,500 Cr | ~₹25,000 Cr | ~₹2,800 Cr | ~8.5x / ~8.9x |
| FY 2013 | ~₹40,000 Cr | ~₹4,200 Cr | ~₹35,000 Cr | ~₹3,400 Cr | ~9.5x / ~10.3x |
| FY 2015 | ~₹48,000 Cr | ~₹3,800 Cr | ~₹40,000 Cr | ~₹2,900 Cr | ~12.6x / ~13.8x |
| FY 2017 (Peak) | ~₹57,000 Cr | ~₹2,400 Cr | ~₹47,000 Cr | ~₹1,800 Cr | ~23.8x / ~26.1x |
Even while revenues grew, the interest burden made it impossible to service debt during the commodity downturn. EBITDA turned insufficient to cover interest costs, let alone principal repayments.
Resolution Under India’s IBC
These cases became a landmark test of India’s Insolvency and Bankruptcy Code (IBC), enacted in 2016. The government prioritized speed, asset preservation, and creditor recovery over prolonged litigation.
| Bhushan Steel Acquired by: Tata Steel One of IBC’s biggest success stories | Bhushan Power & Steel Acquired by: JSW Steel Resolution value: ₹19,700 crore |
BPSL reported EBITDA of ~₹6,423 crore in FY2021-22 under JSW Steel’s ownership, demonstrating that the underlying assets were operationally sound. The failure was a balance sheet failure, not a business failure.
India’s Steel Industry: The Opportunity Was Real
| 59 kg → 119 kg Per Capita Consumption FY2014 to FY2023 — doubled in a decade | ~120 MT Steel Demand FY2023 Growing at 7–8% annually; 2nd largest globally | 93 kg vs 219 kg India vs World Average Per capita gap = massive long-term runway |
India’s domestic capacity is projected to reach 300 MT by 2030 under the National Steel Policy, up from ~179 MT today. The government targets per capita consumption of 160 kg by FY2031. The Bhushan promoters were not wrong about the destination they miscalculated the speed and their own financial durability for the journey.
Post Acquisition Turnaround: Proof the Assets Were Viable
| Tata Steel BSL (formerly Bhushan Steel): Post Acquisition Performance | ||||
| Year | Revenue | EBITDA | EBITDA Margin | Highlights |
| FY2019 (1st full yr) | ~₹17,000 Cr | ~₹3,000 Cr | ~18% | Profitable; integration underway |
| FY2020 | ~₹17,500 Cr | ~₹2,800 Cr | ~16% | Steady; debt reduction ongoing |
| FY2021 | ~₹17,400 Cr | ~₹3,500 Cr | ~20% | Net profit ₹1,914 Cr; debt down ₹5,500 Cr |
| FY2022 | ~₹24,000 Cr | ~₹5,500 Cr | ~23% | Best performance post-acquisition |
| BPSL under JSW Steel: Post Acquisition Performance | ||||
| Period | Revenue | EBITDA | EBITDA Margin | Highlights |
| FY2022 (9M) | ~₹16,500 Cr | ~₹4,850 Cr | ~29% | Best-ever performance; 100% capacity utilization |
| FY2022 Full | ~₹21,000 Cr | ~₹6,423 Cr | ~31% | EBITDA/t at ₹26,000; PAT ₹4,200+ Cr |
| FY2023 (H1) | ~₹10,500 Cr | ~₹2,200 Cr | ~21% | Normalized after commodity cycle peak |
Both acquirers ran the same plants that were declared insolvent, and turned them profitable within 1–2 years. BPSL contributed ~11% of JSW Steel’s consolidated EBITDA at peak (FY2022), confirming that the assets were never the problem. The capital structure was.
Key Lessons: Bhushan Group Case Study
| For Investors 1. Revenue growth ≠ financial health 2. EBITDA alone can mislead, check interest cover 3. Commodity booms create false confidence 4. Study free cash flow and debt levels closely | For Boards & Directors 1. Monitor debt growth and refinancing risk 2. Challenge over optimistic business plans 3. Watch cash flow quality and related-party deals 4. Governance failures amplify business failures |
| For Corporates 1. Expansion must survive downturns, not just booms 2. Cyclical industries demand conservative leverage 3. Liquidity matters more than asset valuation 4. Being directionally right isn’t enough | For Policy / IBC 1. Fast resolution protects asset value 2. Operational assets can recover under new ownership 3. Strong insolvency frameworks attract creditors 4. JSW & Tata Steel acquisitions validated the IBC |
Analytical Framework: 5 Warning Signs That Were Visible
| Debt-to-EBITDA > 5x | A common threshold; Bhushan companies far exceeded it at expansion peak |
| Interest Coverage < 1.5x | Operating profits barely covered interest, leaving no buffer for downturns |
| Capex funded by debt, not equity | No meaningful equity raises during massive expansion phase |
| Related-party transactions | Opaque fund flows and shell companies flagged by auditors |
| Cyclical sector at boom peak | Expansion decisions made during steel price highs, maximum risk point |
| Core Insight: In commodity industries, surviving the downturn is the strategy. Bhushan had the vision; they lacked the financial architecture to outlast the cycle. |