In a manufacturing plant, maintenance performance is often reviewed with the help of lagging indicators like number of breakdowns occurred, maintenance cost incurred, total downtime etc. Those metrics are important to monitor but they are history and just informs what already happened. But the wrench time, provides you insights on what is happening inside maintenance execution on day to day basis: how much of a technician’s shift is used on hands-on work on the equipment.
For maintenance managers, wrench time is a practical lens on planning quality, work readiness, material availability, permits, access, and supervision. For operations managers, it helps by efficiently converting maintenance department resources into availability, reliability, and risk reduction. For digital and transformation leaders, it is a measurable value stream where process discipline and technology (mobile, digital permits, AI scheduling, and agentic automation) can unlock productivity without compromising safety. For enterprise stakeholders, it connects directly to EBITDA, capital efficiency, and ESG outcomes.
This article starts with the shop floor definition of wrench time, then decomposes the losses typical in a any manufacturing plant (static and rotating equipment work, shutdowns/turnarounds, preventive and corrective maintenance etc), and finally takes you to the discussion on plant value and enterprise strategy, with an AI-enabled transformation roadmap.
2. What is Wrench time and Why it is important?
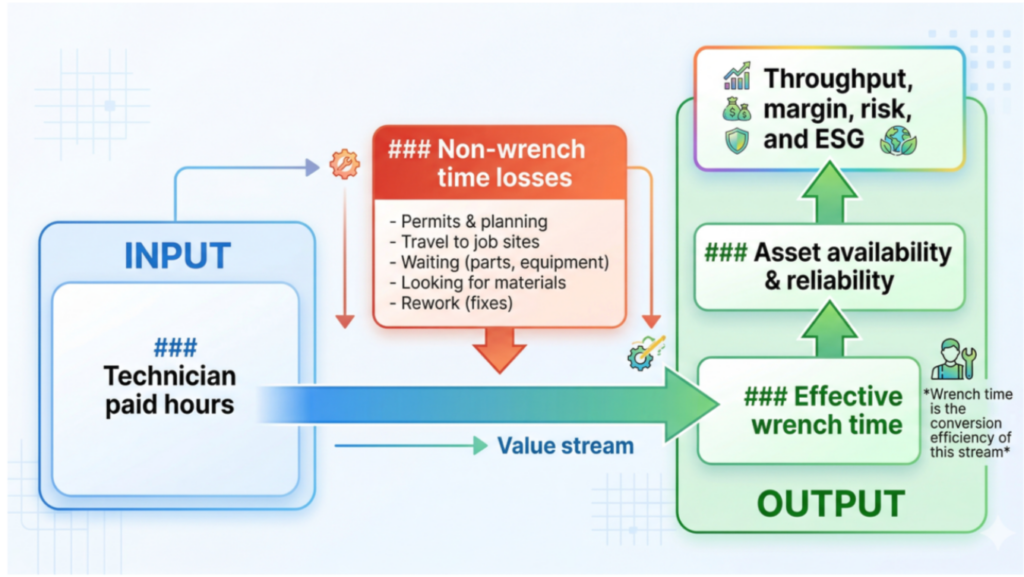
Wrench time is the part of a maintenance technician’s paid time spent on actual value adding, hands on work on the asset using tools, applying skills, executing the job steps that restore or preserve equipment function under the correct permit and safety conditions.
Examples, it is the time actually spent aligning a centrifugal pump, changing a mechanical seal, replacing a PSV, calibrating an instrument excluding the time spent getting ready, waiting, or fixing avoidable problems.
Wrench time is not the same as utilization or productivity.
Utilization (%) = (Assigned or Available for Work ÷ Total Paid Time) × 100
- A Technician can be 100% available but spend hours waiting for scaffolding.
Productivity = (Total Output Produced) ÷ (Total Input Used)
- Suppose a technician completes 20 flanges in one shift, and the total hours spent is 40 hours. Then, Productivity = 0.5 flanges per hour.
Wrench time sits between them: it measures whether the business processes around the technician planning, material movements, permit issue, access preparedness, overall coordination etc., convert physical technician presence into effective, safe execution.
Why it matters in manufacturing plants: Operations and Maintenance departments usually operate independently, in silos. A large share of execution losses comes from system frictions like PTW queues in shift-in-charge rooms, equipment isolations, gas testing, access constraints, SIMOPS, and spares, consumables issue/staging.
Wrench time is therefore a powerful leading indicator of maintenance effectiveness, because it moves before reliability, cost, or availability metrics show up on our dashboard or in your periodic reports. When wrench time improves, schedule compliance typically rises, breakdown work reduces, and more work is completed per shift without increasing risk.
3. Wrench Time Components
A practical manufacturing wrench time model decomposes a shift into value adding hands-on work and distinct loss categories. The purpose of the breakdown is to identify which losses are controllable (owned by maintenance), influenceable (shared with operations, HSE, supply chain, contractors), or structural (layout, regulatory requirements, inherent unit constraints).
Job preparation & planning quality Thie is related to quality of job plan, scope definition, method statements, tooling lists, estimated durations, technician needs, and risk controls.
- Losses by: Incomplete job plans, wrong task sequencing, missing drawings, unclear boundary conditions, inaccurate time estimates, poor job hazard analysis integration
- Control maintenance planning with Influence by engineering/inspection input
Material availability & kitting This is related to having the right spares, consumables at the job site before starting execution.
- Losses by: stock-outs, incorrect part identification, late MRO procurement, parts stuck in QA/QC, poor staging during shutdowns, walk-backs to stores, unplanned substitutions that trigger rework or approvals.
- Control Influenceable: Maintenance + Materials management and address Structural constraints like long lead items, OEM delays
Permit-to-work (PTW) and Job Safety Processes This is related time to obtain a permit, safety brief, and maintaining the permits; gas testing; simultaneous operations coordination; lockout/tagout; and task-specific safety checks (confined space, hot work, work at height, excavation etc).
- Losses by: batching delays at permit room, incomplete permit requests, repeated revisions, unclear isolations, late gas testers, permit revalidation gaps during shift changes, overly manual paperwork.
- Control largely influenceable shared operations/HSE/maintenance with a structural baseline on regulatory and risk requirements.
Travel time & logistics within manufacturing layouts This includes walking/driving to units, gathering tools, moving between permit rooms, stores, laydown, and job sites; plus delays due to access control and transportation constraints.
- Losses by: dispersed work fronts, poor planning in turnarounds, limited vehicles, congested unit access.
- Control partly structural (site layout), partly influenceable (staging, satellite tool stations)
Waiting time (operations, isolations, scaffolding, equipment access) This involved standby while waiting for equipment release, depressurization, draining, cooling, blinds installations, scaffolding erection, insulation removal, rigging, crane availability, or access permits.
- Losses by: late handover from operations, isolation backlog, scaffold crew bottlenecks, poor coordination of cranes and critical-path resources, mis-sequenced work (starting before prerequisites are ready).
- Control mostly influenceable cross-functional with structural constraints like process cooldown time, hazardous area restrictions.
Rework and quality-related losses This includes repeat work required due to errors, missed defects, improper assembly/torque, contamination, inadequate cleanliness, or failure to meet inspection criteria (e.g., flange leaks on start-up; repeated seal failures; instrument drift after calibration).
- Losses by: rushed execution, inadequate skill standards, missing QA, poor flange management, incorrect spares, insufficient supervision, weak post maintenance testing discipline.
- Largely controllable by maintenance quality system and influenceable by inspection/engineering standards
Supervisory, coordination, and communication overhead This includes all the time spent clarifying scope, attending coordination meetings, aligning with operations, managing contractors, documenting work, and resolving conflicts.
- Losses by: unclear roles, excessive meeting cadence without decisions, weak daily planning, handover gaps, poor radio discipline, inadequate field presence of supervisors, late changes from operations priorities.
- Mostly controllable by maintenance practices and influenceable by cross-functional governance.
Actual hands-on tool time (Value adding execution) This represents direct work execution on the equipment
- Losses by: excessive interruptions, unclear scope, repeated starts/stops due to permit or access constraints.
- Control the outcome of the system; increased by removing the losses from all the above areas described rather than pushing speed.
In practice, use this breakdown to create a loss Pareto by unit, maintenance crew, and work type (PM vs CM vs turnaround). The goal is to focus on the few systemic constraints that dominate (often permits/isolation readiness, materials staging, and waiting for access resources), and to assign each loss to the correct owner: what maintenance can fix directly, what requires a joint operating model with operations and HSE, and what must be managed as an inherent constraint.
4. How this links to Maintenance Department Performance?
Wrench time is a mirror of maintenance maturity. In a reactive environment, maintenance hours are consumed by breakdown work, troubleshooting, repeated mobilizations, and emergency permits. Since the work is not planned and emergency in nature, obviously this invites additional waiting, travel, and rework. In a planned environment, work is packaged, materials are kitted, prerequisites are ready, and the day’s schedule is protected so hands-on time rises. In a predictive and reliability led environment, fewer urgent failures exist, the work content is better defined in condition based tasks.
Because it is key to execution flow, wrench time impacts strongly several core maintenance KPIs:
- Schedule compliance: Low wrench time results in low compliance
- Backlog work: When wrench time is low, the same headcount completes fewer quality job hours, backlog grows, and the plant may run toward reactive work
- MTBF (Mean Time Between Failures): Improved wrench time supports completing PMs as planned, increasing MTBF
- MTTR (Mean Time To Repair): Reduces active repair duration
- Maintenance cost per unit and overtime: When non wrench losses dominate, costs rise through overtime, contractor hours, and inefficient spend
5. How this links to Plant Value Dimensions?
Wrench time improvement is not doing the work faster. It is removing execution waste. Wrench time is the conversion efficiency between paid labor hours and risk-reducing, reliability improving work completed at the asset. That conversion then drives plant outcomes:
- Asset availability and reliability: Higher effective wrench time enables more planned work completion (PM, condition-based tasks, defect elimination). This reduces forced outages, unplanned unit downtime
- Maintenance cost optimization: Eliminating losses reduces overtime and contractor dependence and increases throughput of the existing workforce while improved quality reduces repeat failures
- Energy efficiency: Maintenance work that restores heat transfer, rotating equipment efficiency, steam trap performance, and control loop health has direct energy impact. When wrench time is low, these value jobs slip, and energy intensity index moves upward.
- Production loss avoidance: In manufacturing many losses are not full shutdowns; they are constraints example a bottleneck in a pump forcing reduced throughput, exchanger fouling reducing heat transfer, or instrument issues forcing conservative operation. Better wrench time supports faster restoration and more proactive constraint removal.
- Safety performance and risk reduction: Reduced rushing and rework, better permits and isolations readiness, and higher-quality execution all reduce risk exposure hours and operational risk
- Turnaround and shutdown performance: During turnarounds, a large portion of cost and schedule overrun is waiting for scaffolding, crane windows, QA hold points, or late materials. Wrench time analysis provides a fact base to redesign work planning and critical-path control.
6. How this links to Enterprise Business Strategy?
People need to understand the broader impacts to the company, how their work is linked to company’s overall goals weather it is a work of a technician or a work of a CEO. People often think that their work is very small and often fail to understand the impact it can have on a healthy balance sheet and cash flow statements. Wrench time has ability to convert resources (labor, contractors, spares, and downtime windows) into the operational outcomes that management cares about margins, cash flows, risks, and sustainability.
- EBITDA improvement: Higher availability, reduced failures, and better energy performance translate into margin. On the cost side, reduced overtime and more efficient contractor use improves spend
- Capital efficiency and asset life extension: When execution is effective, integrity work is completed on time and to standard. This reduces risk and supports longer run lengths and extended asset life
- ESG outcomes (safety, emissions, waste): Quality maintenance reduces leaks, flaring events tied to equipment failure, and waste associated with repeat work and premature component replacement. Reduced exposure hours and better isolation discipline strengthen process safety
- Workforce productivity and skills strategy: With skills shortages, we cannot rely on adding headcount alone. Improving wrench time effectively creates capacity
- Operational excellence: Most OpEx systems highlights stable operations, standard work, and visual management
7. Assessing the Current Scenario
Manufacturers can assess wrench time with a mix of field observation and system data. The most credible starting point is a short baseline study (typically 2–4 weeks) using structured work sampling across maintenance crew, production units, and work types. Observers classify time into the component categories described earlier (hands-on, permits, travel, waiting, materials, rework, coordination). The output is not a single number it is a loss profile by area and constraint type.
Data sources: CMMS/EAM timestamps (work order creation, planning, approval, scheduling, completion), permit system timestamps, time, planner kitting lists and pick list times, scaffold/rigging request logs, and turnaround reports. In a modern instrumented sites, location coordinates from mobile devices and digital permits can provide objective travel and waiting signals.
A useful way is a maturity assessment across four dimensions:
- People: role clarity for planners/schedulers/supervisors; crew skills mix; contractor integration; coaching capability.
- Process: ready-to-work definitions; weekly scheduling discipline; permit and isolation planning; material kitting and staging; quality assurance and post-maintenance testing.
- Data: clean equipment hierarchies and BOMs; accurate job plans; failure cods; accurate timestamps; consistent work order statuses.
- Technology: EAM, mobile execution, digital permits/isolation management, analytics for constraints, integration between operations and maintenance systems.
8. Tools and Interventions to Improve Wrench Time
High-performing manufacturers improve wrench time by strengthening the execution systems for planning, readiness, and field execution management before implementing advanced digital.
- Advanced / AI driven maintenance planning and scheduling
- Standard job plans and work packs
- Materials management and kitting optimization
- Permit process simplification, Digital permits and isolation management
- Visual management and daily management systems
- Supervisor enablement and role clarity
- EAM/CMMS optimization and data quality
- Mobile maintenance and digital work instructions
- Predictive and prescriptive maintenance to reduce unplanned work
9. Digital, Agentic AI and GenAI Enablement
Digital tools do not automatically increase wrench time; they increase wrench time when they remove process bottlenecks and improve work readiness. It helps to distinguish three capability levels:
Automation: Systems execute predefined steps:
- Automated Work Order Creation: Automatically generate and populate work orders using sensor data, operator notifications, and asset histories, reducing manual entry and accelerating maintenance initiation
- Approval Routing Automation: Digital systems route work orders, permits, and exception requests to the correct approvers based on predefined rules, ensuring timely reviews and compliance
- Automated Materials Management: Systems generate pick lists, reserve materials from inventory, and trigger procurement workflows based on job plan requirements and stock levels
- Automated Permit Issuance: Digital permit systems issue, renew, and track permits for isolation, hot work, and confined space, integrating with maintenance schedules and safety checks
- Auto-Scheduling and Dispatch: Solutions like SAP PM, IBM Maximo automatically schedule maintenance tasks based on asset criticality, technician availability, and operational constraints
- Automated Kitting and Laydown: Systems coordinate kitting activities, ensuring all materials and tools are staged for upcoming jobs, with notifications for shortages or delays
- Automated Data Capture and Reporting: Mobile devices and sensors record task progress, completion, and exceptions, updating EAM/CMMS records in real time, and generating shift handover reports automatically
- Automated Visual Management: Digital dashboards display real-time progress, constraint logs, and resource allocation, enabling daily management and rapid escalation of bottlenecks
- Automated Predictive Maintenance Actions: Systems trigger maintenance work orders automatically based on condition monitoring, vibration analysis, or anomaly detection
- Automated Exception Handling: Agents monitor for permit aging, delayed material picks, or missed scaffolding starts, and automatically alert responsible parties, propose recovery actions, and escalate as needed
- Automated Compliance and Quality Checks: Systems enforce hold points, post-maintenance testing routines, and compliance verifications, generating digital records for audit and continuous improvement
- Automated Job Plan Library Updates: As tasks are completed and learnings are captured, job plan libraries are automatically updated to reflect best practices and lessons learned
Decision support: Analytics and AI recommend actions (e.g., optimal weekly schedule based on constraints; predicted risk of late materials; suggested job duration ranges).
- Schedule Optimization: AI-driven tools analyze asset criticality, technician availability, and operational constraints to recommend optimal weekly and daily maintenance schedules, maximizing wrench time while minimizing production disruption.
- Risk Prediction for Material Delays: Predictive analytics evaluate supply chain data, historical trends, and current inventory to forecast the likelihood of material shortages or late deliveries, enabling proactive procurement or contingency planning.
- Dynamic Job Duration Estimation: Machine learning models assess past work order data, asset health, and complexity to suggest realistic job duration ranges, supporting accurate planning and resource allocation.
- Permit and Compliance Risk Assessment: AI systems scan permit records and safety data to flag potential compliance risks, such as expired permits or missing isolation steps, and recommend corrective actions.
- Work Order Prioritization: Advanced analytics classify and prioritize incoming maintenance notifications based on asset criticality, process risk, and potential impact on production, guiding planners to address the most urgent issues first.
- Resource Allocation Recommendations: Decision support platforms analyze technician skill profiles, work history, and real-time availability to propose optimal resource assignments for each job, ensuring the right expertise is deployed.
- Failure Mode Detection and Action Suggestions: AI interprets sensor and operational data to recognize emerging failure modes, recommend targeted inspections or preventive actions, and reduce unplanned downtime.
- Constraint Management and Escalation: Digital dashboards highlight bottlenecks, such as delayed scaffolding or permit aging, and suggest escalation paths or recovery actions to ensure jobs proceed as planned.
- Shift Handover Recommendations: AI summarizes ongoing work, exceptions, and critical actions for shift handovers, ensuring clear communication between teams and seamless continuity of operations.
Autonomous or agentic execution: Software agents take actions within guardrails (e.g., triage and classify new notifications, draft work orders, propose job plans, reserve materials, raise exceptions, and coordinate approvals), handing off to humans for verification and risk critical decisions.
GenAI copilots for maintenance technicians, planners, and supervisors
Maintenance Technicians
- A GenAI copilot streamlines technicians’ daily tasks by instantly answering job-related questions, reducing time spent searching for information.
- When assigned a job, the copilot summarizes the asset’s maintenance history, flags recurring issues, and highlights failure modes, helping technicians avoid repeated errors.
- Technicians can quickly access up-to-date standards and method statements through the copilot, ensuring compliance and safety.
- The copilot can generate a job-specific checklist for technicians to verify each step in real time, minimizing the risk of missing critical actions.
- During shift handovers, the copilot automatically creates concise summaries of ongoing work and exceptions, based on the latest work order statuses and field notes.
Maintenance Planners
- A GenAI copilot helps maintenance planners by automating the creation and optimization of job plans, analyzing historical data to recommend task steps, tools, and durations for efficient job preparation.
- For specific tasks, such as valve overhauls, the copilot suggests tools, spare parts, and operation sequences based on previous successful plans and asset health records, ensuring jobs are well-prepared.
- The copilot aids in scheduling by considering technician availability, asset criticality, and operational constraints, recommending optimal job timings and highlighting potential bottlenecks like permit or material delays.
- Planners can use copilot insights to proactively adjust schedules, reserve materials, and coordinate approvals, lowering the risk of unplanned downtime.
- When priorities shift or urgent notifications arise, the copilot triages work orders, classifies them by risk and impact, and flags issues needing immediate attention.
- Routine planning tasks and exception handling are automated, allowing planners to focus on risk management and reliability improvement, supporting a stable and optimized maintenance process.
Maintenance Supervisors
- GenAI copilot automates drafting of daily plans and escalation paths, helping supervisors prioritize critical tasks and allocate resources efficiently.
- The copilot synthesizes ongoing work, technician assignments, and bottlenecks such as delayed scaffolding or permit issues into a clear daily action plan.
- Supervisors receive real-time alerts on compliance risks (e.g., expired permits, missing isolation steps), with recommended corrective actions to maintain safety and regulatory compliance.
- During shift handovers, the copilot generates concise summaries of exceptions, critical actions, and job progress, improving communication and operational continuity between teams.
- By automating routine coordination and exception handling, the copilot enables supervisors to focus on team coaching, constraint management, and driving continuous improvement in wrench time and reliability.
10. Conclusion
Wrench time is a connecting metric: it links the reality of a technician’s shift to the plant outcomes that matter. When used well, it shifts the conversation from “working harder” to “designing a better execution system,” where operations, maintenance, HSE, and supply chain jointly remove constraints.
Organizations will have to treat wrench time as a continuously monitored value stream. Mobile execution and digital PTW will make readiness visible in real time; decision support models will optimize schedules around constraints; and agentic AI will handle routine and exception chasing, freeing planners and supervisors to focus on high value adding tasks like risk management, and reliability improvement. The plants that win will be those that combine this technology with disciplined work management and a culture that values safe, first-time-right execution.